
Excel Workbooks
Risk and Performance Measures
Examples
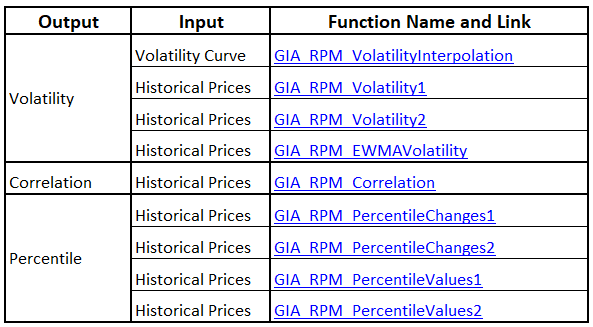
Files illustrating the use of functions come with the Navigator spreadsheet, which provides a list of outputs, inputs of market data, the names of the functions used in the file and their descriptions. Clicking on the function name will bring you to the relevant cells in the required spreadsheet. Following is an example from the GIA_RPM_Examples_2 file (the column showing the functions' descriptions is not shown here).
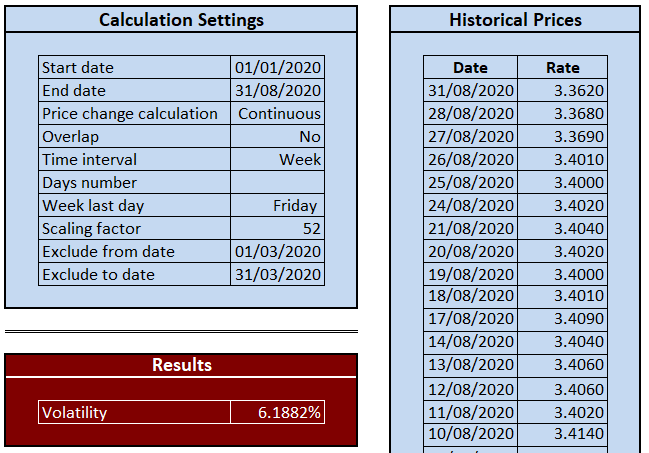
Most spreadsheets share the same structure. They consist of three sections:
- Calculation Settings
- Historical Prices
- Results
We will demonstrate this using the Volatility1 spreadsheet from the file GIA_RPM_Examples_2:
Templates
This group of workbooks illustrate the examples of implementations and can serve as the basis for further developments and adjustments.