
Excel Workbooks
Financial Instruments
Workbooks illustrating the use of functions come with the Navigator spreadsheet, with list of outputs, inputs of market data, the names of the functions used in the file and their descriptions. Clicking on the function name will bring you to the relevant cells in the required spreadsheet. Following is an example from the GIA_IRD_Examples_CrossCurrency file (the column showing the functions' descriptions is not shown here).
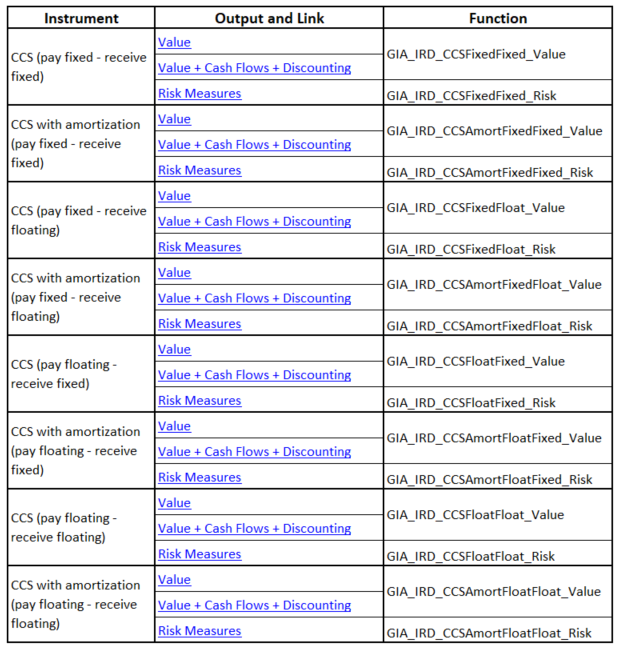
All spreadsheets share the same structure. They consist of four sections:
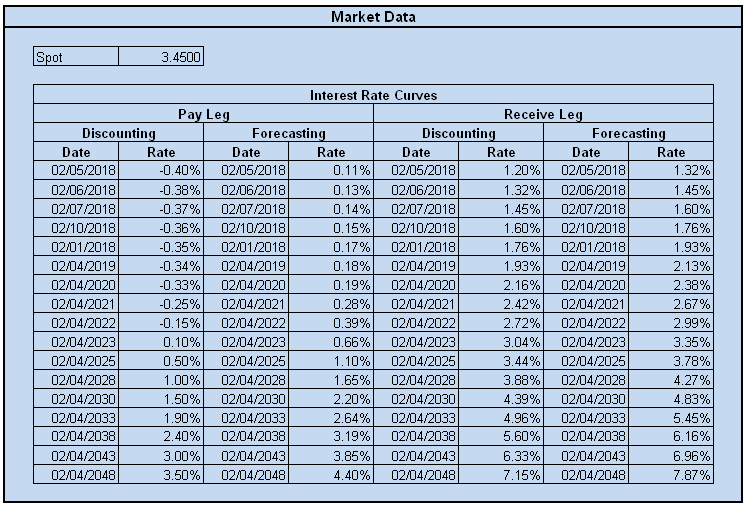
- The terms of the instrument
- Market data
- Calculation settings
- Results
We will demonstrate this using the CCSFloatFloatAmort spreadsheet from the file IRD_Examples_CrossCurrency.
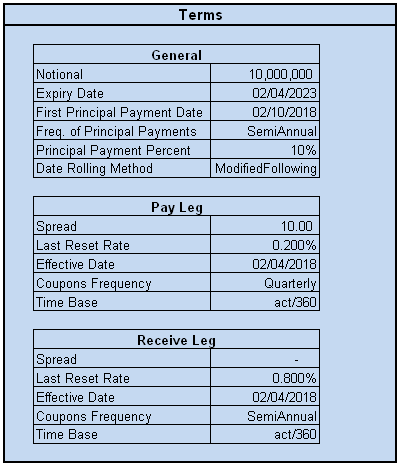
In cells with parameters for which a list of possible values is provided, the values are presented in a dropdown list, as can be seen in the following examples:

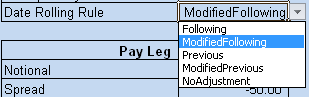
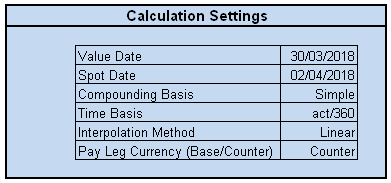
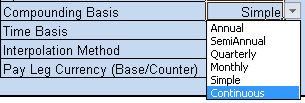
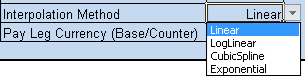
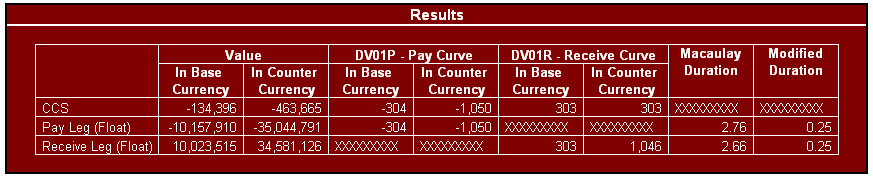
For the user's convenience, the spreadsheets were designed so that the order of the parameters in the spreadsheet matches the order of the parameters in the function:
GIA_IRD_CCSAmortFloatFloat_Value
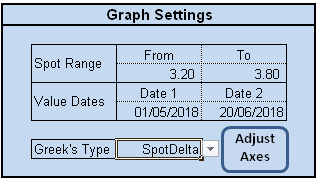
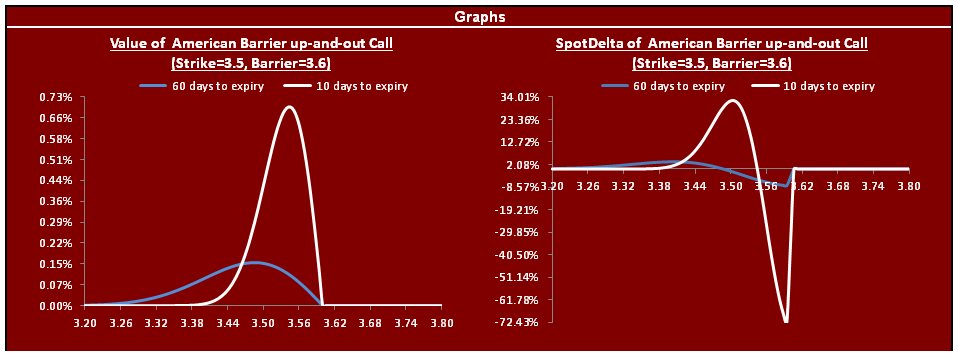
In addition to the four sections presented in all files, the FXD-Vanilla, FXD_Exotics, EQD_VanillaE and EQD_Exotics files have two additional sections – Graph Settings and Graphs, as shown below:
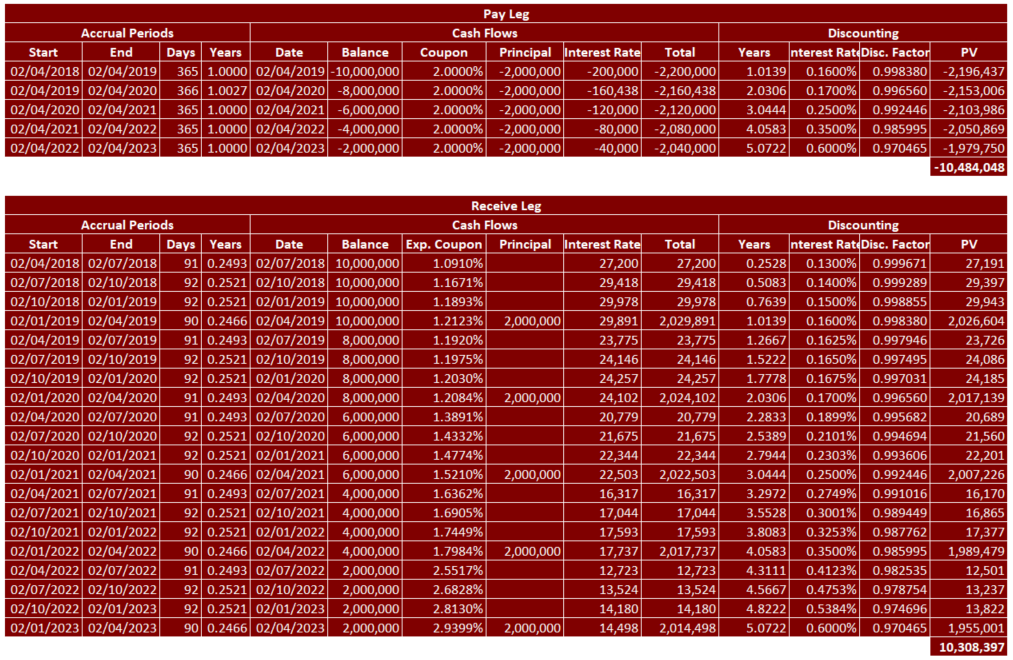
The workbooks covering functions in GIA_Bonds, GIA_IRD and GIA_IND contain spreadsheets that, by clicking the following button, generate a table including future cash flows and their present values:
Templates
This group of workbooks illustrate the examples of implementations and can serve as the basis for further developments and adjustments. Among popular implementions one can find valuation of portfolios consisted of various financial instruments, building zero curve using Nelson-Siegel model and stress scenario analysis of interest rates and FX derivatives.
Manual Calculations
In interest rate derivatives module and in the inflation module there is a group of workbooks in which manual calculations are shown and their results are compared to the ones of the functions. The manual calculations alow deeper understanding of the instrument and to validate the function result.