
Risk and performance measures module
Calculate various risk and performance measures within a specified time periods, based on the historical data.
Instrument coverage and functionality
22 functions related to risk and performance measures
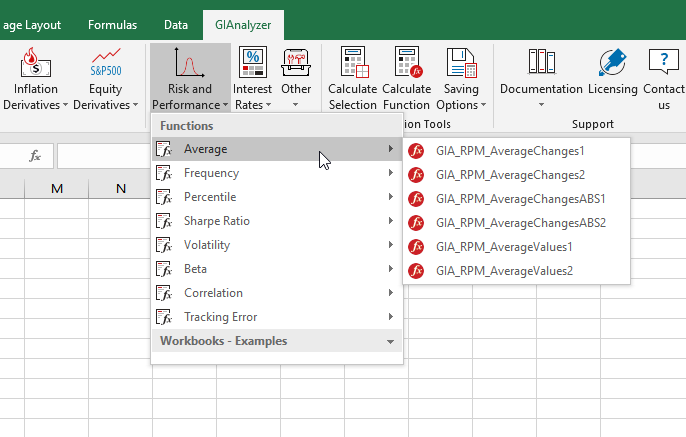
Functions in this module calculate the following measures
- Average of changes/values
- Beta
- Correlation
- Frequency of changes/values
- Percentile of changes/values
- Sharpe ratio
- Tracking error
- Volatility
In most functions you can change start and end dates, time period of the price changes (days, week, month…), define whether the changes are overlapped or not, exclude a specific period etc.
Excel examples and templates
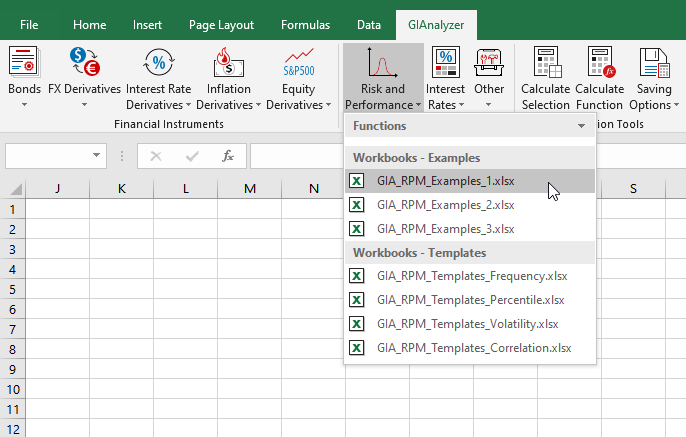
7 Excel workbooks with dozens of spreadsheets illustrating the use of functions and their various implementations
3 Excel workbooks accompanied with the module include examples of all functions related to risk and performance measures. We recommend to use the relevant workbooks before your first use of the specific function.
4 additional Excel workbooks include templates, illustrating various calculations of volatility, correlation, frequency and percentile.
Download now and try free for 30 days.
Fully featured version, no credit card required.

Windows 7 – 10
Frequent questions
Are the risk and performance measures calculated based on daily changes in historical prices?
It depends on the parameter defining the time interval of the changes, which can be set as a day, number of days, a week, a month, a quarter and a year.
Can we exclude a specific period from the calculation?
Absolutely, you can define the start and the end of the period which will be excluded from the calculation.
If the historical changes are not daily, are they overlapped or not?
There is a parameter defining whether the changes are overlapped or not.
Do the functions in this module cover relative risk and performance measures?
Yes, in most risk and performance measures, in addition to calculations based of the changes of single asset, there are calculations based on the difference between changes in prices of two assets.