
Example and template workbooks
Last updated 10 November 2026
GIAnalyzer comes with workbooks, opened from the bottom of each menu on the GIAnalyzer tab.
- Workbooks - Examples show how to use the functions. They are the quickest way to learn a new function.
- Workbooks - Templates show a fuller use, and are a starting point for your own work: portfolio valuation for FX and interest rate derivatives, zero curves built with Nelson-Siegel and Nelson-Siegel-Svensson, scenario analysis for bonds, an employee share option package, and correlation, frequency, percentile and volatility analysis.
- Workbooks - Manual Calculations, in the Interest Rate Derivatives and Inflation Derivatives menus, work a valuation out step by step and compare the result with the function's. They are there to show what a function does, and to check it. They cover basis swaps, caps and floors, cross-currency swaps in all four leg combinations, interest rate swaps, overnight index swaps, swaptions, real rate swaps and zero coupon inflation swaps.
Opening a workbook
Click the workbook's name in the menu. It opens read-only, so the original stays unchanged. To keep your changes, use File > Save As and save a copy in your own folder.
A workbook opens only when your licence includes its module. Otherwise the Licensing window opens instead. See Activating your licence.
Workbooks whose names end in .xlsm contain macros, for example for the
buttons that build cash-flow tables. If Excel shows a security warning, click
Enable Content to use them.
The Navigator sheet
Most example workbooks open with a Navigator sheet. It lists the outputs, the market data each calculation takes, and the functions used in the workbook, with a description of each. Click a function's name to go to the cells that use it.

How an example sheet is laid out
The sheets for financial instruments (bonds, FX, interest rate, inflation and equity derivatives) have four sections:
- Terms of the instrument
- Market data
- Calculation settings
- Results
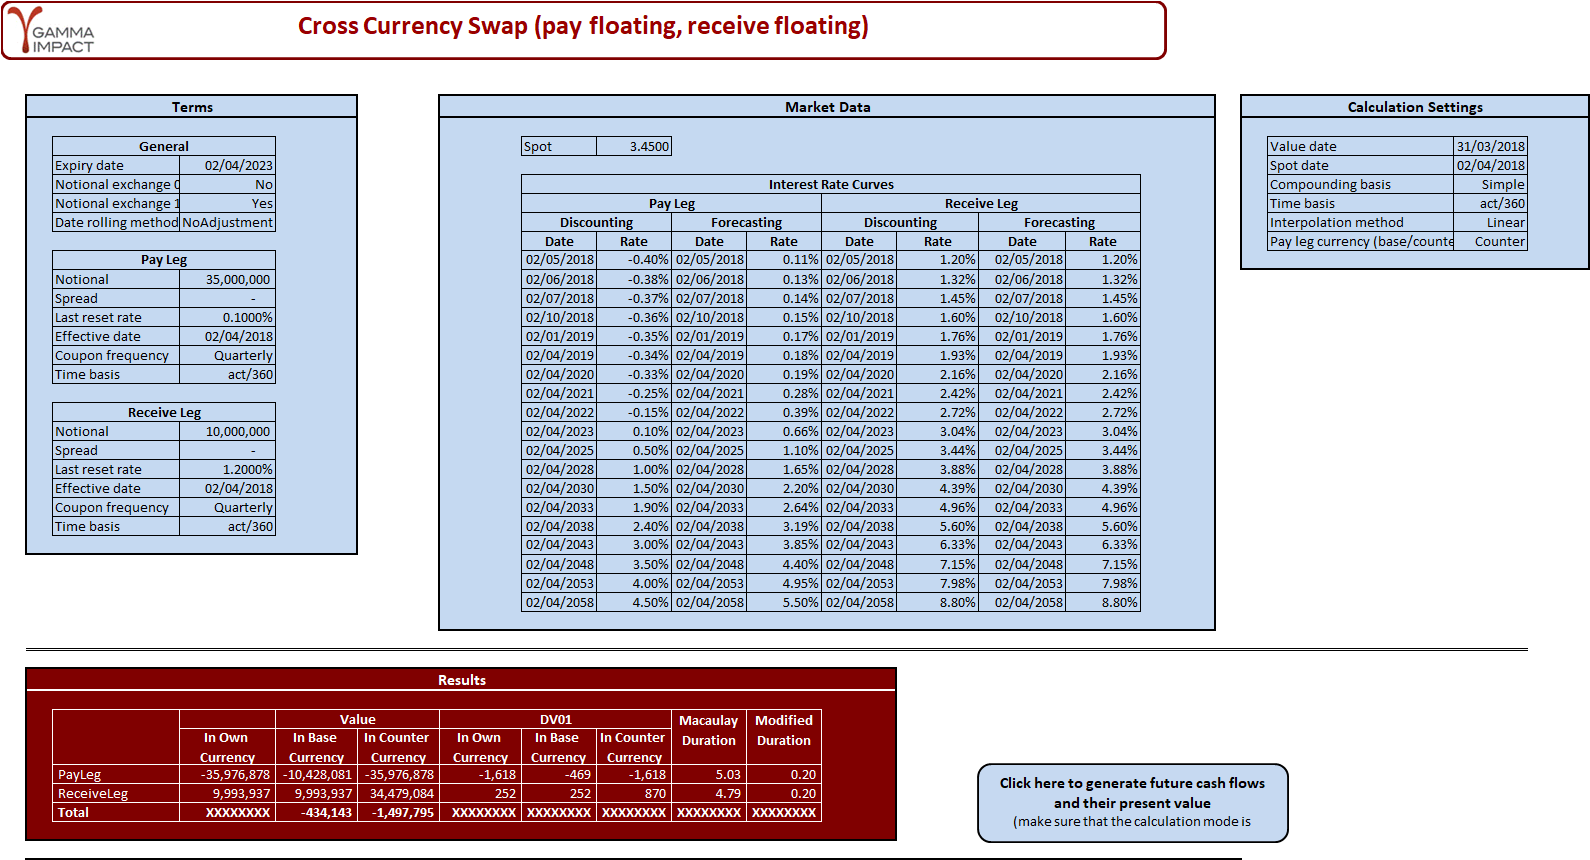
Click the picture to see it full size.
Where a parameter takes one of a set list of values, such as a date-rolling rule, a compounding basis or an interpolation method, the cell has a drop-down list.
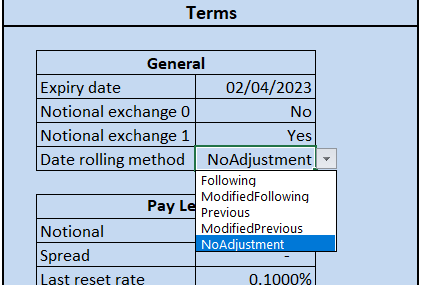
The parameters are laid out in the order the function takes them, so the formula reads straight down the sheet.
Some workbooks add to this:
- The FX and equity option workbooks have two more sections, Graph Settings and Graphs.
- In the bonds, interest rate derivatives and inflation derivatives workbooks, some sheets have a button that builds a table of future cash flows and their present values.
The Interest Rates and Risk and Performance workbooks use a simpler layout of three sections: the data (for risk and performance, the historical prices), the calculation settings, and the results.